


요꼬가와는 1915년 창립이래 계측, 제어, 정보기술을 축으로
최첨단의 제품을 산업계에 제공함으로써 사회 발전에 공헌해오고 있습니다.
제품기초지식
파형 데이터 및 전력 값 원격 모니터링

 파형 데이터 및 전력 값 원격 모니터링.pdf (1.6 MB)
IS8000 통합 소프트웨어 플랫폼

1. 서론
모터/인버터 평가 시험에서는 시험실에서 파형 측정기 및 전력계를 실제로 조작하여 데이터를 수집할 수 있습니다 . 실제 조작자는 이러한 장비의 작동에 익숙한 경우가 많습니다. 파형 측정기의 샘플링 속도, 메모리 길이, T/div, 필터, 평균값 등의 설정을 변경하고, 실제 화면 표시와 측정 조건을 비교하면서 측정 작업을 수행합니다. 마찬가지로, 전력계에서는 입력측의 직류 전압/전류/전력, 출력측의 3상 전압/전류/전력, 주파수, 역률, 인버터 효율, 모터 효율 등 원하는 데이터를 선택하고, 데이터 업데이트 속도, 주기 검출 필터, 파형 표시 방식 등의 설정을 변경하여 측정 작업을 시작합니다.
2. 문제점
시험실에 설치된 파형 측정기와 전력계는 해당 장비의 작동법을 숙지한 작업자가 조작할 수 있지만, 모터와 인버터가 실제로 가동 중일 때는 작업자가 시험실에 출입할 수 없는 경우가 많습니다. 예상치 못하게 측정 전에 임시로 설정해 둔 조건들이 실제 측정에서는 불충분한 경우가 빈번하게 발생합니다.
이러한 경우, 작업자는 안전을 확보하기 위해 모터와 인버터를 일시적으로 정지시킨 후 시험실에 다시 들어가 파형 측정기와 전력계가 있는 곳으로 이동하여 파형 또는 수치 설정을 조정해야 합니다. 이 과정에 몇 분이 소요될 수 있습니다. 결과적으로 모터와 인버터가 반복적으로 가동 및 정지되어 작업 효율이 매우 떨어집니다.
반면, PC 소프트웨어를 이용한 통신을 통해 데이터를 손쉽게 수집할 수 있습니다. 그러나 오실로스코프 PC 소프트웨어와 전력계 PC 소프트웨어는 별도의 소프트웨어이므로 각각 실행하고 조작해야 합니다. 일반적으로 오실로스코프의 설정 항목은 주로 파형 측정을 위한 것이고, 전력계의 설정 항목은 주로 수치 측정(수치 표시)을 위한 것이므로 조작 절차가 다릅니다.
더욱이, 오실로스코프나 전력계 본체의 설정 절차 및 작동 방식과 PC 소프트웨어에서의 작동 방식은 하드웨어와 소프트웨어의 설계 메커니즘 차이로 인해 종종 다릅니다. 이로 인해 작업자는 제품 본체와 PC 소프트웨어 간의 조작성 차이로 인해 작업 효율을 향상시키는 데 어려움을 겪을 수 있습니다.
3. IS8000 솔루션
4. IS8000 솔루션 (상세 설명)
4.1 온라인 모니터를 이용한 데이터 확인 및 조작
온라인 모니터 조작을 통해 통신 인터페이스를 이용하여 PC에서 측정 기기를 원격으로 제어할 수 있습니다.
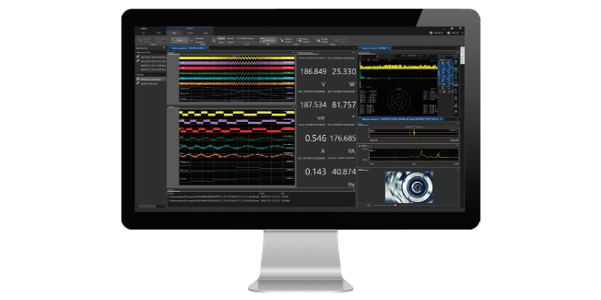
DL950 스코프코더 또는 WT5000 파워 분석기 본체의 터치 패널 화면(제어 화면)이 PC 화면에 표시됩니다. 사용자는 측정 기기를 조작하는 것과 동일한 방식으로 원격 위치에서 PC를 통해 설정을 자유롭게 변경하거나 측정된 파형 및 전력계 데이터를 확인할 수 있습니다. 기기 본체의 소프트웨어와는 다른 새로운 소프트웨어 작동법을 학습할 필요가 없습니다. 사용자는 설정 및 파형 표시를 확인하여 문제가 없는지 확인한 후 파형 또는 전력계 데이터 수집을 시작할 수 있습니다.
제어실에서 멀리 떨어진 DL950의 파형을 PC에서 확인할 수 있으므로, 파형 데이터를 저장하거나 설정 조건을 변경하기 위해 시험실과 제어실을 오가는 번거로움 없이 효율적인 데이터 수집이 가능합니다.

그림 1. DL950 리모컨 화면

그림 2. WT5000 리모컨 화면
4.2 DL 소프트웨어와 WT 소프트웨어의 통합
기존에는 오실로스코프 소프트웨어와 전력계 소프트웨어의 파일 형식이 서로 달라 데이터를 수집할 때 각기 다른 소프트웨어 도구를 사용해야 했습니다. 새롭게 개발된 통합 측정 플랫폼 IS8000은 파형 데이터와 전력계 데이터의 동시 측정을 위한 통합 측정 소프트웨어로서, 두 가지 측정 요구 사항을 모두 충족할 수 있습니다. 데이터 수집 소프트웨어 도구를 통합함으로써, 오실로스코프와 전력계를 각각 사용하여 측정하고 데이터를 저장하는 기존 방식에 비해 파일 정리 및 관리 작업량을 크게 줄일 수 있습니다.

그림 3. IS8000 통합 측정 플랫폼의 시작 화면

그림 4. 프로젝트 파일과 분할된 파일 통합
4.3 IEEE1588 WT/DL 시간 동기화 표시
파형 측정 장비의 파형 계산 기능을 이용하여 전력값을 표시함으로써 검증하는 경우가 있지만, 측정된 파형과의 소급성을 갖춘 매우 정확한 전력값을 얻기는 어려운 경우가 있습니다. IS8000 통합 측정 소프트웨어 플랫폼은 IEEE 1588 시간 동기화를 사용하여 DL950과 WT5000을 동시에 연결*함으로써 간편한 동기화 측정을 가능하게 합니다. DL950과 WT5000의 동기화 오차는 약 10마이크로초입니다.
WT5000의 전력 파라미터는 DL950에서 최대 20ms/s로 동시에 수집된 8개 채널의 연속 파형 데이터와 함께 PC의 동일한 시간 축에 표시할 수 있습니다. 이를 통해 전력계 데이터의 추세를 파형 데이터와 함께 시계열로 표시하여 전력의 미세한 변동까지 확인할 수 있습니다. 따라서 전력 변동으로 인해 특정 시점에 발생하는 파형 이상 데이터를 확인하고 문제점을 찾아낼 수 있습니다.
* IEEE1588 표준: 네트워크에 연결된 장치 간의 시간 동기화에 사용되는 정밀 시간 프로토콜(PTP)입니다 . * DL950 IEEE1588 마스터 기능(/C40 옵션)이 필요합니다. * DL950의 2개 장치 동기화 오차는 150ns 이내입니다. * DL950 10Gbps 이더넷(/C60 옵션)이 필요합니다. * 2개 이상의 장치를 동기화하여 측정하려면 IS8000 다중 장치 동기화 옵션(/SY1)이 필요합니다 .

그림 5. 파형 데이터의 사후 분석
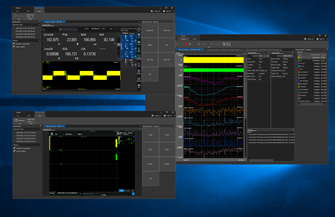
그림 6. PC 화면에 표시된 WT5000 및 DL950 모니터

그림 7. 전력 데이터와 파형 데이터 동기화 화면
4.4 프로젝트 파일 저장을 통한 통합 파일 관리
IS8000 통합 측정 플랫폼은 개별 파일을 하나의 프로젝트 파일로 관리할 수 있습니다. 따라서 파형 데이터 파일과 전력 데이터 파일을 동일한 이름으로 저장하여 서로 연관시키거나, 각 측정 데이터별로 폴더를 생성하고 그 안에 파형 파일과 전력 데이터 파일을 저장하는 번거로움이 사라집니다.
데이터 파일은 시간 단위로 분할하여 저장할 수 있습니다. 전체 측정 기간의 데이터와 측정 중 분석할 기간의 데이터를 별도의 파일로 저장할 수 있습니다. 예를 들어 24시간 동안 측정하는 경우, 파일을 1시간 단위로 분할하여 측정이 완료된 구간의 데이터를 분석하면서 나머지 측정은 계속 진행할 수 있습니다.
측정이 완료되면 전체 측정 기간 파일과 분할된 파일들을 하나의 프로젝트 파일로 관리할 수 있습니다. DL950 두 대를 사용한 측정이나 DL950과 WT5000을 사용한 측정 또한 하나의 프로젝트 파일로 관리할 수 있습니다. DL950과 WT5000을 사용한 측정에서도 파일 이름을 지정할 필요가 없어 개발 효율성을 크게 향상시킬 수 있습니다.

그림 8. 프로젝트 파일과 분할된 파일 통합
4.5 정확도가 보장된 신뢰할 수 있는 전력 데이터 활용
파형 측정기에 전력값 계산 기능을 탑재한 제품이 증가하고 있습니다. 파형 측정기를 이용한 전력값 계산은 과도 현상 발생 시에도 데이터의 동시성을 보장할 수 있어 매우 유용합니다. 그러나 사용자는 국가 표준에 부합하는 전력 데이터의 정확도 보장에 유의해야 합니다. 파형 측정기의 주된 목적은 전압 프로브와 전류 프로브를 사용하여 높은 대역폭과 높은 샘플링 속도로 측정 신호의 파형을 더욱 정확하게 포착하는 것입니다. 즉, 전력계와 달리 파형 측정기를 이용한 전력 계산 결과는 정확도가 보장되지 않으므로 신뢰성을 신중하게 검증해야 합니다. 요코가와의 전력 분석기는 국가 표준에 연계된 매우 정밀한 측정 기준과 추적성을 보장하며, 전압, 전류, 위상, 주파수에 대한 높은 신뢰성의 측정값을 제공합니다.
IS8000 통합 측정 소프트웨어 플랫폼에서는 전력 추적성을 보장하는 WT5000을 통한 전력 측정 과 DL950을 통한 20ms/s의 속도로 8채널 데이터 전송이 가능합니다. 신뢰할 수 있는 전력 값과 파형 데이터를 동일한 시간 축에 동시에 표시할 수 있습니다.
4.6 파형 및 전력계 데이터를 이용한 자동 보고서 생성
자동 보고서 생성 옵션(/SY1)을 사용하면 PC에서 보고서를 생성하고 출력할 수 있습니다. 사용자는 보고서 생성 마법사 기능을 이용하여 보고서 레이아웃(이미지 표시 포함)을 설정함으로써 간편하게 보고서를 생성할 수 있습니다. DL950 스코프코더 또는 WT5000 정밀 전력계로 측정 또는 저장된 파일 중에서 측정 조건, 파형 출력, 측정 결과 또는 기타 데이터를 선택할 수 있습니다. 보고서는 PDF 또는 Excel 파일로 출력할 수 있습니다.
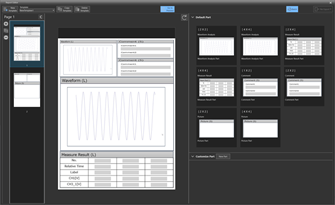
그림 9. 보고서 템플릿 편집 화면

그림 10. 보고서 생성 화면
IS8000 Integrated Software Platform

1. Introduction
In the motor/inverter evaluation test, data may be collected by actually operating the waveform measurement instrument and power meter in the test room. Actual operators are often familiar with the operation. They change the waveform measurement instrument’s settings, such as sampling rate, memory length, T/div, filter, or average, and carry out measurement work while comparing the actual screen display with the measurement conditions. Similarly, they decide on the power meter data they want, such as DC voltage/current/power on the input side and three-phase voltage/current/power, frequency, power factor, inverter efficiency, and motor efficiency on the output side, and change the data update rate, cycle detection filter, waveform display, and other settings to start the measurement work.
2. Challenges
A waveform measurement instrument and power meter in the test room can be operated by a worker who is familiar with their operations, but the worker is often not allowed to enter the test room while motors and inverters are actually in operation. Unexpectedly, there are many cases in which the setting conditions temporarily set before measurement are insufficient in actual measurement.
In such cases, the worker temporarily stops the motors and inverters to ensure safety to re-enter the test room and then goes to where the waveform measurement instrument and power meter are located and configure waveform or numerical settings. This may take several minutes. Consequently, the motors and inverters are repeatedly started and stopped, leading to extremely poor work efficiency.
On the other hand, data can be easily collected via communication using PC software. However, the oscilloscope PC software and power meter PC software are separate software tools, so the two pieces of software need to be started and operated. In general, setting items on an oscilloscope is mainly for waveform measurement and those on a power meter are mainly for numerical measurement (numerical display), requiring different operating procedures.
Furthermore, the setting procedure and operation on the oscilloscope or power meter main unit and those from the PC software are often different because of the difference in the design mechanism between hardware and software. Operators may have difficulty in improving work efficiency due to the difference in operability between the product main unit and the PC software.
3. IS8000 Solution

4. IS8000 Solution (Detailed descriptions)
4.1 Data checking and operation by online monitor
The online monitor operation allows measurement instruments to be controlled remotely from a PC via a communication interface.
The touch panel screen (control screen) of the DL950 ScopeCorder or WT5000 Power Analyzer main unit is displayed on the PC screen. A user can freely change the settings or check the measured waveform and power meter data from a PC at a remote location in the same manner as operating the measurement instrument. There is no need to newly learn the operations of software that are different from those of the instrument main unit. The user can simply check the settings and waveform display to make sure there is no problem, then begin collecting the waveform or power meter data.
The waveform on the DL950 located away from the control room can be checked on the PC, which enables efficient data collection without the trouble of going back and forth between the test room and control room to save the waveform data or change the setting conditions.


Figure 2. WT5000 remote control screen
4.2 Integration of DL software and WT software
Conventionally, the oscilloscope software and power meter software have different file formats and it is necessary to collect data using different software tools. The newly developed integrated measurement platform IS8000 can be used as one integrated measurement software to meet the measurement needs for synchronous measurement of waveform data and power meter data. By integrating the data collection software tools, it has become possible to significantly reduce the work of organizing and managing files, compared to the way of collecting data by separately performing measurements with an oscilloscope and a power meter and saving the measured data.

Figure 3. Startup screen of IS8000 integrated measurement platform

Figure 4. Integrating a project file and divided files
4.3 IEEE1588 WT/DL time-synchronized display
There are cases where power values are verified by displaying them using the waveform calculation function of a waveform measurement instrument, but a highly accurate power value with traceability with a measured waveform cannot be obtained. The IS8000 integrated measurement software platform enables easy synchronized measurement by connecting* the DL950 and WT5000 at the same time using IEEE 1588-time synchronization. The synchronization error of DL950 and WT5000 is approximately 10 micro-seconds.
The power parameters of the WT5000 can be displayed on the same time axis on a PC along with the continuous waveform data of eight ch simultaneously acquired at up to 20 MS/s by the DL950. This makes it possible to display the trend of power meter data in time series together with the waveform data, allowing slight fluctuations in power to be checked. It, therefore, becomes possible to check the waveform abnormality data occurring at a certain time from the power fluctuations and find the problem.
* IEEE1588 standard: a precision time protocol (PTP) used to synchronize time
between devices connected on a network. PTP=Precision Time Protocol
* DL950 IEEE1588 master function(/C40 option) is required.
* 2 units synchronization error of DL950 is within 150 ns.
* DL950 10 Gbps Ethernet (/C60 option) is required.
* IS8000 multi-unit synchronization option (/SY1) is required for synchronized measurement of two or more units.

Figure 5. post analysis of waveform data

Figure 6. WT5000 and DL950 monitor display on the PC screen
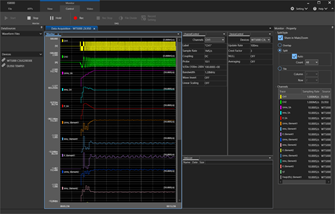
Figure 7. Power data and waveform data sync screen
4.4 Integrated file management by project file saving
The IS8000 integrated measurement platform can manage individual files as one project file. This eliminates the need to save a waveform data file and a power data file with the same name in order to associate them with each other or the need to manage files by creating a folder for each measurement data and storing a waveform file and a power data file in that folder.
A data file can be divided into segments by specifying the length of time. The data for an entire measurement period and the date of the period to be analyzed during the measurement can be saved as separate files. For example, when measuring for 24 hours, the user can divide the file into one-hour segments and analyze the data of the segments where the measuring process is finished while continuing the measurement.
After the measurement is completed, the file for the entire measurement period and the divided files can be managed as a project file. Measurement using two DL950s or measurement using the DL950 and WT5000 can also be managed as one project file. There is no need to associate file names even in the measurement with the DL950 and WT5000 which strongly supports the improvement of development efficiency.
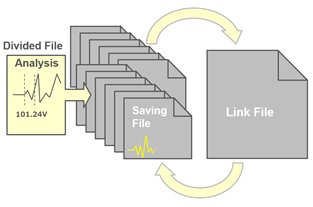
Figure 8. Integrating a project file and divided files
4.5 Utilization of reliable power data with guarantee accuracy
The number of products that incorporate a function to calculate power values into waveform measurement instruments is increasing. It is very useful to calculate power values using a waveform measurement instrument because the simultaneity of data can be ensured even in a transient phenomenon. However, the user should pay attention to the assurance of the accuracy of power data traceable to national standards. The main purpose of waveform measurement instruments is to capture the shape of a measured signal more accurately with the high bandwidth and high sample rate by using a voltage probe and current probe. In other words, unlike a power meter, the result of a power calculation by a waveform measurement instrument has no guarantee of accuracy, and it is necessary to carefully verify the reliability. Yokogawa’s power analyzers ensure highly precise measurement standards and traceability that are linked to national standards and provide highly reliable measurements of voltage, current, phase, and frequency.
On the IS8000 integrated measurement software platform, power measurement by the WT5000, which ensures power traceability, and eight-channel data transfer at 20 MS/s by the DL950 are available. Reliable power values and waveform data can be displayed on the same time axis at the same time.
4.6 Automatic report creation using waveform and power meter data
The automatic report creation option (/SY1) allows report creation and output on a PC.A user can easily create a report by setting the report layout (with image display) using the report creation wizard function. From the files measured or saved by the DL950 ScopeCorder or the WT5000 Precision Power Analyzer, the user can choose measurement conditions, waveform output, measurement results, or other data. The report can be output to PDF or EXCEL.

Figure 9. Report template edit screen

Figure 10. Report creation screen
Related Industries
Related Products & Solutions

DL950 ScopeCorder
Capture and analyze a wide variety of electromechanical signals and serial buses. High sample rate, long recording times, advanced triggers, and real-time analysis.
IS8000 Integrated Software Platform
- Data acquisition, control, and analysis
- IEEE1588 & High speed camera synchronization
- Serial bus, FFT, and harmonic/flicker analysis
- Compatible with WT/DL/DLM, USB/Ethernet/MODBUS

SL2000 High-Speed Data Acquisition Unit
The SL2000 is a high-speed, modular data acquisition system that combines the functionality of an isolated oscilloscope with the flexibility of a high-speed DAQ, ideal for design validation, ATE systems and operational testing. Compatible with all plug-in modules as the DL950, up to five DL950 and SL2000 units can be linked and synchronized.

WT5000 - Highest Precision
- Up to 7 wattmeters / Modular
- 0.01% of rdg + 0.02% of rng
- DC to 1MHz
- 4 motor inputs
- Harmonics to 500th order
- IEC 61000 compliance testing
하단영역
한국요꼬가와전기(주)
사업자등록번호 102-81-17301
경기도 용인시 기흥구 기흥로 58-1 기흥 ICT밸리 SK V1 A동 407호 ~ 411호 (우) 16976 (분당선 기흥역 2번 출구 500m)
T&M 영업본부 : 02-2628-3813
서비스팀 :02-2628-3872
팩스 : 02-2628-3899
COPYRIGHT ⓒ 2024 YOKOGAWA ELECTRIC CORPORATION. ALL RIGHTS RESERVED.